

Commercial property values after the credit crunch
Key points
-
The credit crunch is pushing up yields on unlisted office, retail and industrial property.
-
The downside in Australian unlisted commercial property values is likely to be limited by relatively good demand/supply fundamentals and more conservative pricing than has been evident overseas.
-
Unlisted commercial property returns are expected to slow substantially. Shares, including listed property trusts (LPTs), are likely to provide better returns over the next year or so.
Introduction
Last year saw direct (or unlisted) commercial property funds (office, retail and industrial) return around 21%. By contrast, LPTs lost 8.4%, their worst calendar return ever. In fact, from their high in February last year to their low last month, LPTs fell 41% in value in response to the impact of the global credit crunch.
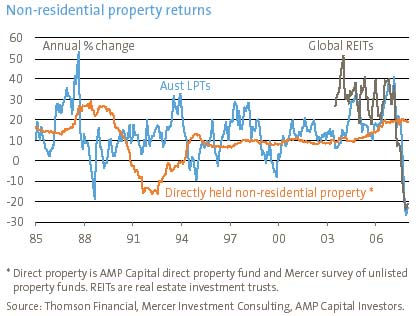
The big issue is to what degree the fall in LPTs presages falling commercial property values. Anyone who thinks unlisted property values can’t fall doesn’t remember the early 1990s when they fell for three years in the aftermath of a building boom and recession – see chart above.
Reasons for concern
Returns from directly held office, retail and industrial property in Australia accelerated over the last few years on the back of strong growth in rents (reflecting tightening underlying supply and demand conditions) and investors being prepared to buy buildings on lower yields.
The global credit crunch and worries about a US led economic downturn suggest that unlisted commercial property yields are now on the rise:
-
The credit crunch has increased the cost (and cut the availability) of debt used to fund property purchases;
-
Pressures to reduce gearing levels are leading to forced property sales (such as Centro, Allco, MFS);
-
Moves by industry superannuation funds to cut direct property weights inflated by falls in shares could add to selling; and
-
Economic conditions are likely to deteriorate leading to lower demand for property space causing weaker rents.
For the March quarter, unlisted property yields rose about 0.25%. (At current yields each 0.25% rise in yields means a 4% fall in values if rents are unchanged.)
Reasons not to expect a re-run of the early 1990s
Several factors suggest investors should not be too worried. Firstly, the fall in unlisted property yields in recent years was largely justified by the fall in inflation from the 1980s which had pushed down interest rates and income yields for bonds, shares, LPTs and housing.
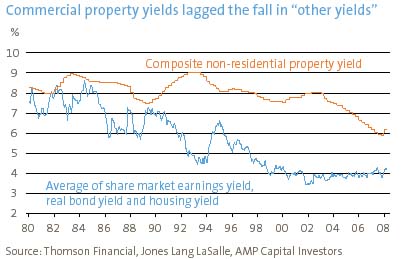
The previous chart shows a composite of office, retail and industrial yields versus an average of bond, equity and housing yields.
Secondly, while Australian bond yields rose in the last two years, directly held non-residential property still offers a satisfactory risk premium over bonds. The next chart assumes constant property rental and capital growth of 2.5% per annum (pa). This has been added to the composite non-residential property yield and the 10-year bond yield has been subtracted to show a property risk premium.
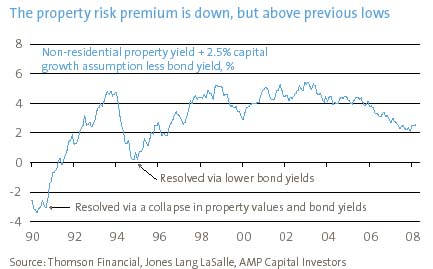
While the excess return expected from commercial property over bonds has declined, it is far more attractive than prior to the early 1990s slump in property values.
Thirdly, while there is some evidence that LPTs lead direct property, LPTs are very volatile. As evident in the next chart, movements in LPT distribution yields have been far more extreme than the yields on offer for unlisted commercial property. This has seen LPT share prices trade wildly around the value of their underlying buildings. In fact, LPT’s 5.1% yields a year ago saw them trading at a greater than 20% premium to the underlying value of the properties they represent. It’s also likely that currently reported distribution yields for LPTs of around 7.5% based on historic distributions will exaggerate actual yields as some trusts have cancelled or cut distributions to reduce debt.
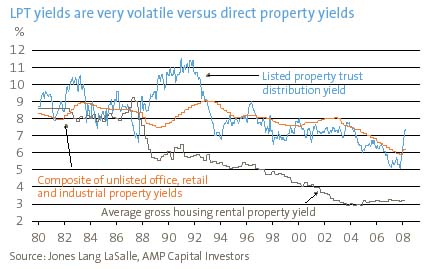
Thus, while the rise in LPT yields suggests upwards pressure on unlisted commercial property yields, their recent rise is likely to exaggerate the actual pressure. The low rental yields on residential property suggests that it is particularly vulnerable – but that is a separate story.
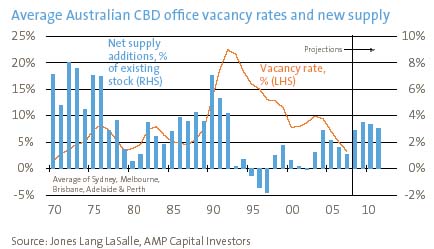
Fourthly, space demand/supply fundamentals are good versus the early 1990s. For example, the supply of new office space is running below the levels that created big trouble in the early 1990s. The next chart shows net new central business district (CBD) office space supply (with projections based on current construction and approvals data) against the vacancy rate. There doesn’t appear to be a general office overbuilding problem, unlike in the early 1990s. While finance sector employment will slow in Sydney, it has modest new supply in prospect. By contrast, Perth and Brisbane, which are seeing the strongest supply pick-up, are underpinned by the resources boom. Compared to the situation in 1990, we are less into the office construction cycle now so there is more scope for projects to be shelved. Hence, absent a severe recession, a re-run of the 1990s surge in vacancies seems unlikely. CBD office vacancy rates are now very low at an average 3-4% and while rising office supply points to an increase in the next few years it will probably only be to around 6-8%, well below the 20% plus of the early 90s.
Reflecting the good demand/supply balance for property space at present, rental growth remains strong and this should help offset the impact of upwards pressure on property yields in terms of the impact on property values.
Finally, it’s hard to see superannuation funds piling out of direct property. Most see exposure to direct property as strategic and too illiquid to justify making big shifts, particularly in response to shifts in the value of volatile listed assets.
The last point worth raising is that Australian commercial property was more conservatively priced compared to that in the US and UK.
Concluding comments
The credit crunch and concerns about the economic outlook will likely put further upwards pressure on yields for commercial property. Lower quality property where yields have fallen the most and selling pressure is greatest, and mortgage belt shopping centres susceptible to reduced retail sales are most vulnerable. However, barring a recession or end to the resources boom, both of which are unlikely, the rise in yields and the impact on property values is likely to be limited by reasonable valuations for direct property and good demand/supply fundamentals driving solid rental growth. However, returns will be well down on the 20% returns of last year. Due to their higher yields and the fact they are now trading at a 15% discount to property valuations, listed property trusts offer better returns on a 12-month view.
Dr Shane Oliver, Head of Investment Strategy and Chief Economist
AMP Capital Investors